Behind the Scenes: How BeachOps Predicts the Tide Hour-by-Hour
December 15, 2025 4 min read
Ever wondered how the BeachOps System generates that smooth, hourly tide graph from NEA’s basic tide table data?
Let’s take a peek behind the curtain.
Hello Sentosa Beach Patrol Team
While the traditional Rule of Twelfths gives a quick rough estimate (see comparison below), BeachOps uses a more accurate method called Sinusoidal Interpolation — the same mathematical model used by meteorological agencies.
This ensures the data you see every day is as reliable as possible for safety planning and daily briefings.
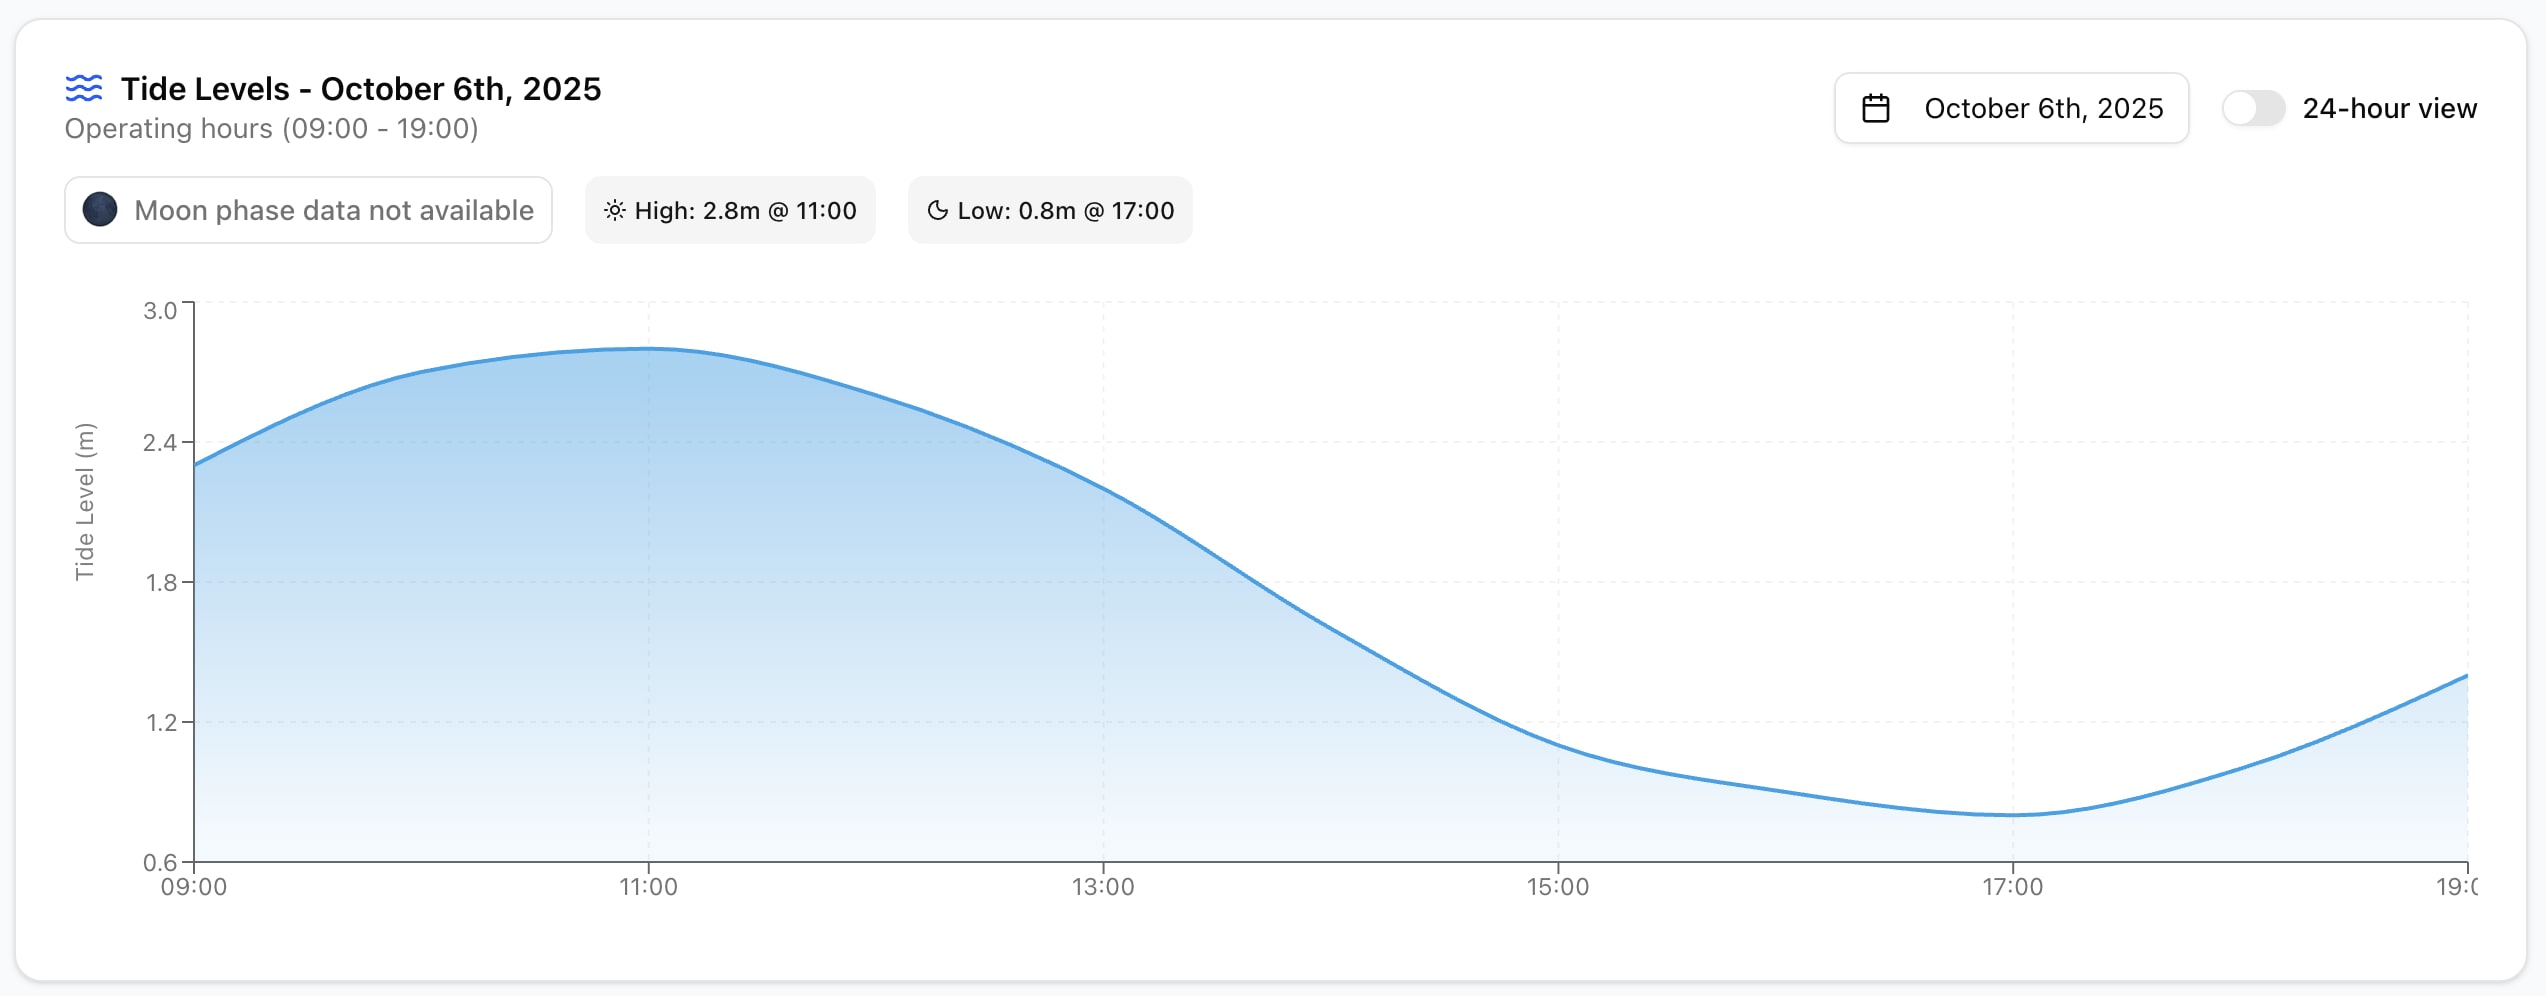
Let’s break down how it works, using the tide data for 6th October 2025.
Raw Data from NEA
| Time | Height (m) | Type |
|---|---|---|
| 0424 | 0.5 | Low Tide |
| 1039 | 2.8 | High Tide |
| 1639 | 0.8 | Low Tide |
| 2239 | 3.0 | High Tide |
Method 1: The Rule of Twelfths (Quick Estimate)
This classic mariner’s rule assumes the tide changes in six equal hourly steps — 1/12, 2/12, 3/12, 3/12, 2/12, 1/12 of the total range.
Applying it from 0424 (Low) to 1039 (High):
- Range: 2.8 – 0.5 = 2.3 m
- Height at ~0824:
0.5 + (1/12 + 2/12 + 3/12 + 3/12) × 2.3 = 2.23 m
Verdict: It’s simple, but it doesn’t follow the natural smooth curve of the tide.
Method 2: Sinusoidal Interpolation (BeachOps Standard)
This is the method BeachOps uses. It models the tide as a sine wave — a much better reflection of how the sea actually rises and falls due to the gravitational pull of the moon and sun.
Formula:
Height(t) = Low_Height + (High_Height - Low_Height)
            * [ (1 - cos(π * (t - Low_Time) / (High_Time - Low_Time)) ) / 2 ]
Manual calculation for 0800:
- Low = 0.5 m at 0424 (4.4 h)
- High = 2.8 m at 1039 (10.65 h)
- Target = 0800 (8.0 h)
- Fraction = (8.0 – 4.4) / (10.65 – 4.4) = 0.576
- Result = 0.5 + 2.3 × [ (1 – cos(π × 0.576)) / 2 ] = 1.92 m
Comparison:
Rule of Twelfths → 2.23 m | Sinusoidal → 1.92 m
That 30 cm difference can matter in real beach operations.
The Python Engine
Now, how does BeachOps compute this automatically every hour of every day?
Here’s the core function powering the system:
import math
    from datetime import datetime, timedelta

    def interpolate_tide_height(low_time, low_height, high_time, high_height, target_time):
        total_duration = (high_time - low_time).total_seconds()
        elapsed = (target_time - low_time).total_seconds()
        fraction = elapsed / total_duration
        return low_height + (high_height - low_height) * ((1 - math.cos(math.pi * fraction)) / 2)
This function runs inside a Python script that:
- Loads the four daily tide events from NEA.
- Detects which cycle (Low→High or High→Low) each hour belongs to.
- Applies the formula to calculate the tide height.
- Outputs hourly results for the BeachOps dashboard.
Sample Output (6 Oct 2025)
| Time | Height (m) |
|---|---|
| 00:00 | 0.8 * |
| 01:00 | 0.7 * |
| … | … |
| 04:00 | 0.53 |
| 0424 | 0.5 (Low) |
| 05:00 | 0.62 |
| 06:00 | 0.94 |
| 07:00 | 1.48 |
| 08:00 | 1.92 |
| 09:00 | 2.37 |
| 10:00 | 2.67 |
| 1039 | 2.8 (High) |
Values before the first data point are estimated from the previous day’s cycle.
Conclusion
Accurate tidal data helps Sentosa lifeguards plan safe zones, anticipate rip currents, and make better operational decisions.
By using sinusoidal interpolation, BeachOps provides precise, hour-by-hour tide information — turning complex ocean dynamics into an easy-to-read curve on your screen.
Next time you check the tide graph, you’ll know there’s real science (and a few lines of Python) behind it.
Stay safe and vigilant —
Sentosa BeachOps Team